Filters and Throughputs
Calculated filter characteristics and transmission curves are given below. All are based on standard reflectivity or transmission data for various surfaces, unless a part specific curve was provided by the manufacturer. No transmissive optics (ADCs, etc) are currently accounted for.
The atmosphere is included in the numbers presented in the table below. BTRAM was used to calculate the atmospheric transmission for LCO, and the below values assume a zenith distance of 30 degrees and 5.0 mm PWV. A version of each curve is provided without the atmosphere contribution, which can then be combined with the atmosphere of your choice.
None of these values have been verified on sky. They should be used for planning purposes only.
Visible Science Cameras
Filters in the visible science cameras.
camsci1
Filter |
WFS B/S |
Sci BS |
\(\lambda_0\) [µm] |
\(w_\mathrm{eff}\) [µm] |
\(\mathrm{QE}_\mathrm{max}\) |
\(F_0\) [photon / sec] |
Files |
|---|---|---|---|---|---|---|---|
H-alpha Cont. |
H-alpha/IR |
H-alpha |
0.668 |
0.009 |
0.22 |
\(3.8\times10^{9}\) |
|
ip |
65/35 |
ri |
0.764 |
0.120 |
0.11 |
\(2.1\times10^{10}\) |
|
zp |
65/35 |
ri |
0.908 |
0.130 |
0.08 |
\(1.3\times10^{10}\) |
|
rp |
65/35 |
open |
0.615 |
0.110 |
0.23 |
\(6.1\times10^{10}\) |
|
ip |
65/35 |
open |
0.762 |
0.126 |
0.11 |
\(2.2\times10^{10}\) |
|
zp |
65/35 |
open |
0.908 |
0.131 |
0.09 |
\(1.3\times10^{10}\) |
|
CH4 |
65/35 |
50/50 |
0.875 |
0.026 |
0.04 |
\(1.3\times10^{9}\) |
|
rp |
65/35 |
50/50 |
0.615 |
0.112 |
0.11 |
\(2.9\times10^{10}\) |
|
ip |
65/35 |
50/50 |
0.762 |
0.126 |
0.06 |
\(1.1\times10^{10}\) |
|
zp |
65/35 |
50/50 |
0.908 |
0.130 |
0.04 |
\(6.3\times10^{9}\) |
camsci2
Filter |
WFS B/S |
Sci BS |
\(\lambda_0\) [µm] |
\(w_\mathrm{eff}\) [µm] |
\(\mathrm{QE}_\mathrm{max}\) |
\(F_0\) [photon / sec] |
Files |
|---|---|---|---|---|---|---|---|
H-alpha |
H-alpha/IR |
H-alpha |
0.656 |
0.009 |
0.23 |
\(3.5\times10^{9}\) |
|
gp |
65/35 |
ri |
0.527 |
0.041 |
0.24 |
\(3.1\times10^{10}\) |
|
rp |
65/35 |
ri |
0.613 |
0.106 |
0.23 |
\(5.9\times10^{10}\) |
|
CH4 Cont. |
65/35 |
50/50 |
0.923 |
0.023 |
0.04 |
\(9.6\times10^{8}\) |
|
gp |
65/35 |
50/50 |
0.525 |
0.044 |
0.13 |
\(1.9\times10^{10}\) |
|
rp |
65/35 |
50/50 |
0.614 |
0.109 |
0.12 |
\(3.3\times10^{10}\) |
|
ip |
65/35 |
50/50 |
0.762 |
0.126 |
0.06 |
\(1.1\times10^{10}\) |
|
zp |
65/35 |
50/50 |
0.909 |
0.132 |
0.04 |
\(6.7\times10^{9}\) |
WFS
Filters in the main WFS.
WFS B/S |
Filter |
\(\lambda_0\) [µm] |
\(w_\mathrm{eff}\) [µm] |
\(\mathrm{QE}_\mathrm{max}\) |
\(F_0\) [photon / sec] |
Files |
|---|---|---|---|---|---|---|
H-alpha/IR |
open |
0.837 |
0.205 |
0.20 |
\(5.3 \times 10^{10}\) |
|
65/35 |
open |
0.791 |
0.296 |
0.08 |
\(4.2 \times 10^{10}\) |
LOWFS
Filters in the low-order WFS.
Atmosphere
Atmospheric transmission curves for Cerro Manqui. These were calculated by Jared using the BTRAM IDL code. Individual files linked below, and the complete set can be downloaded .
ZD |
PWV [mm] |
PWV [mm] |
PWV [mm] |
PWV [mm] |
PWV [mm] |
PWV [mm] |
|---|---|---|---|---|---|---|
[deg] |
0.0 |
2.5 |
5.0 |
7.5 |
10.0 |
12.5 |
0.0 |
||||||
15.0 |
||||||
30.0 |
||||||
45.0 |
||||||
60.0 |
Specifying Guide Star Magnitude
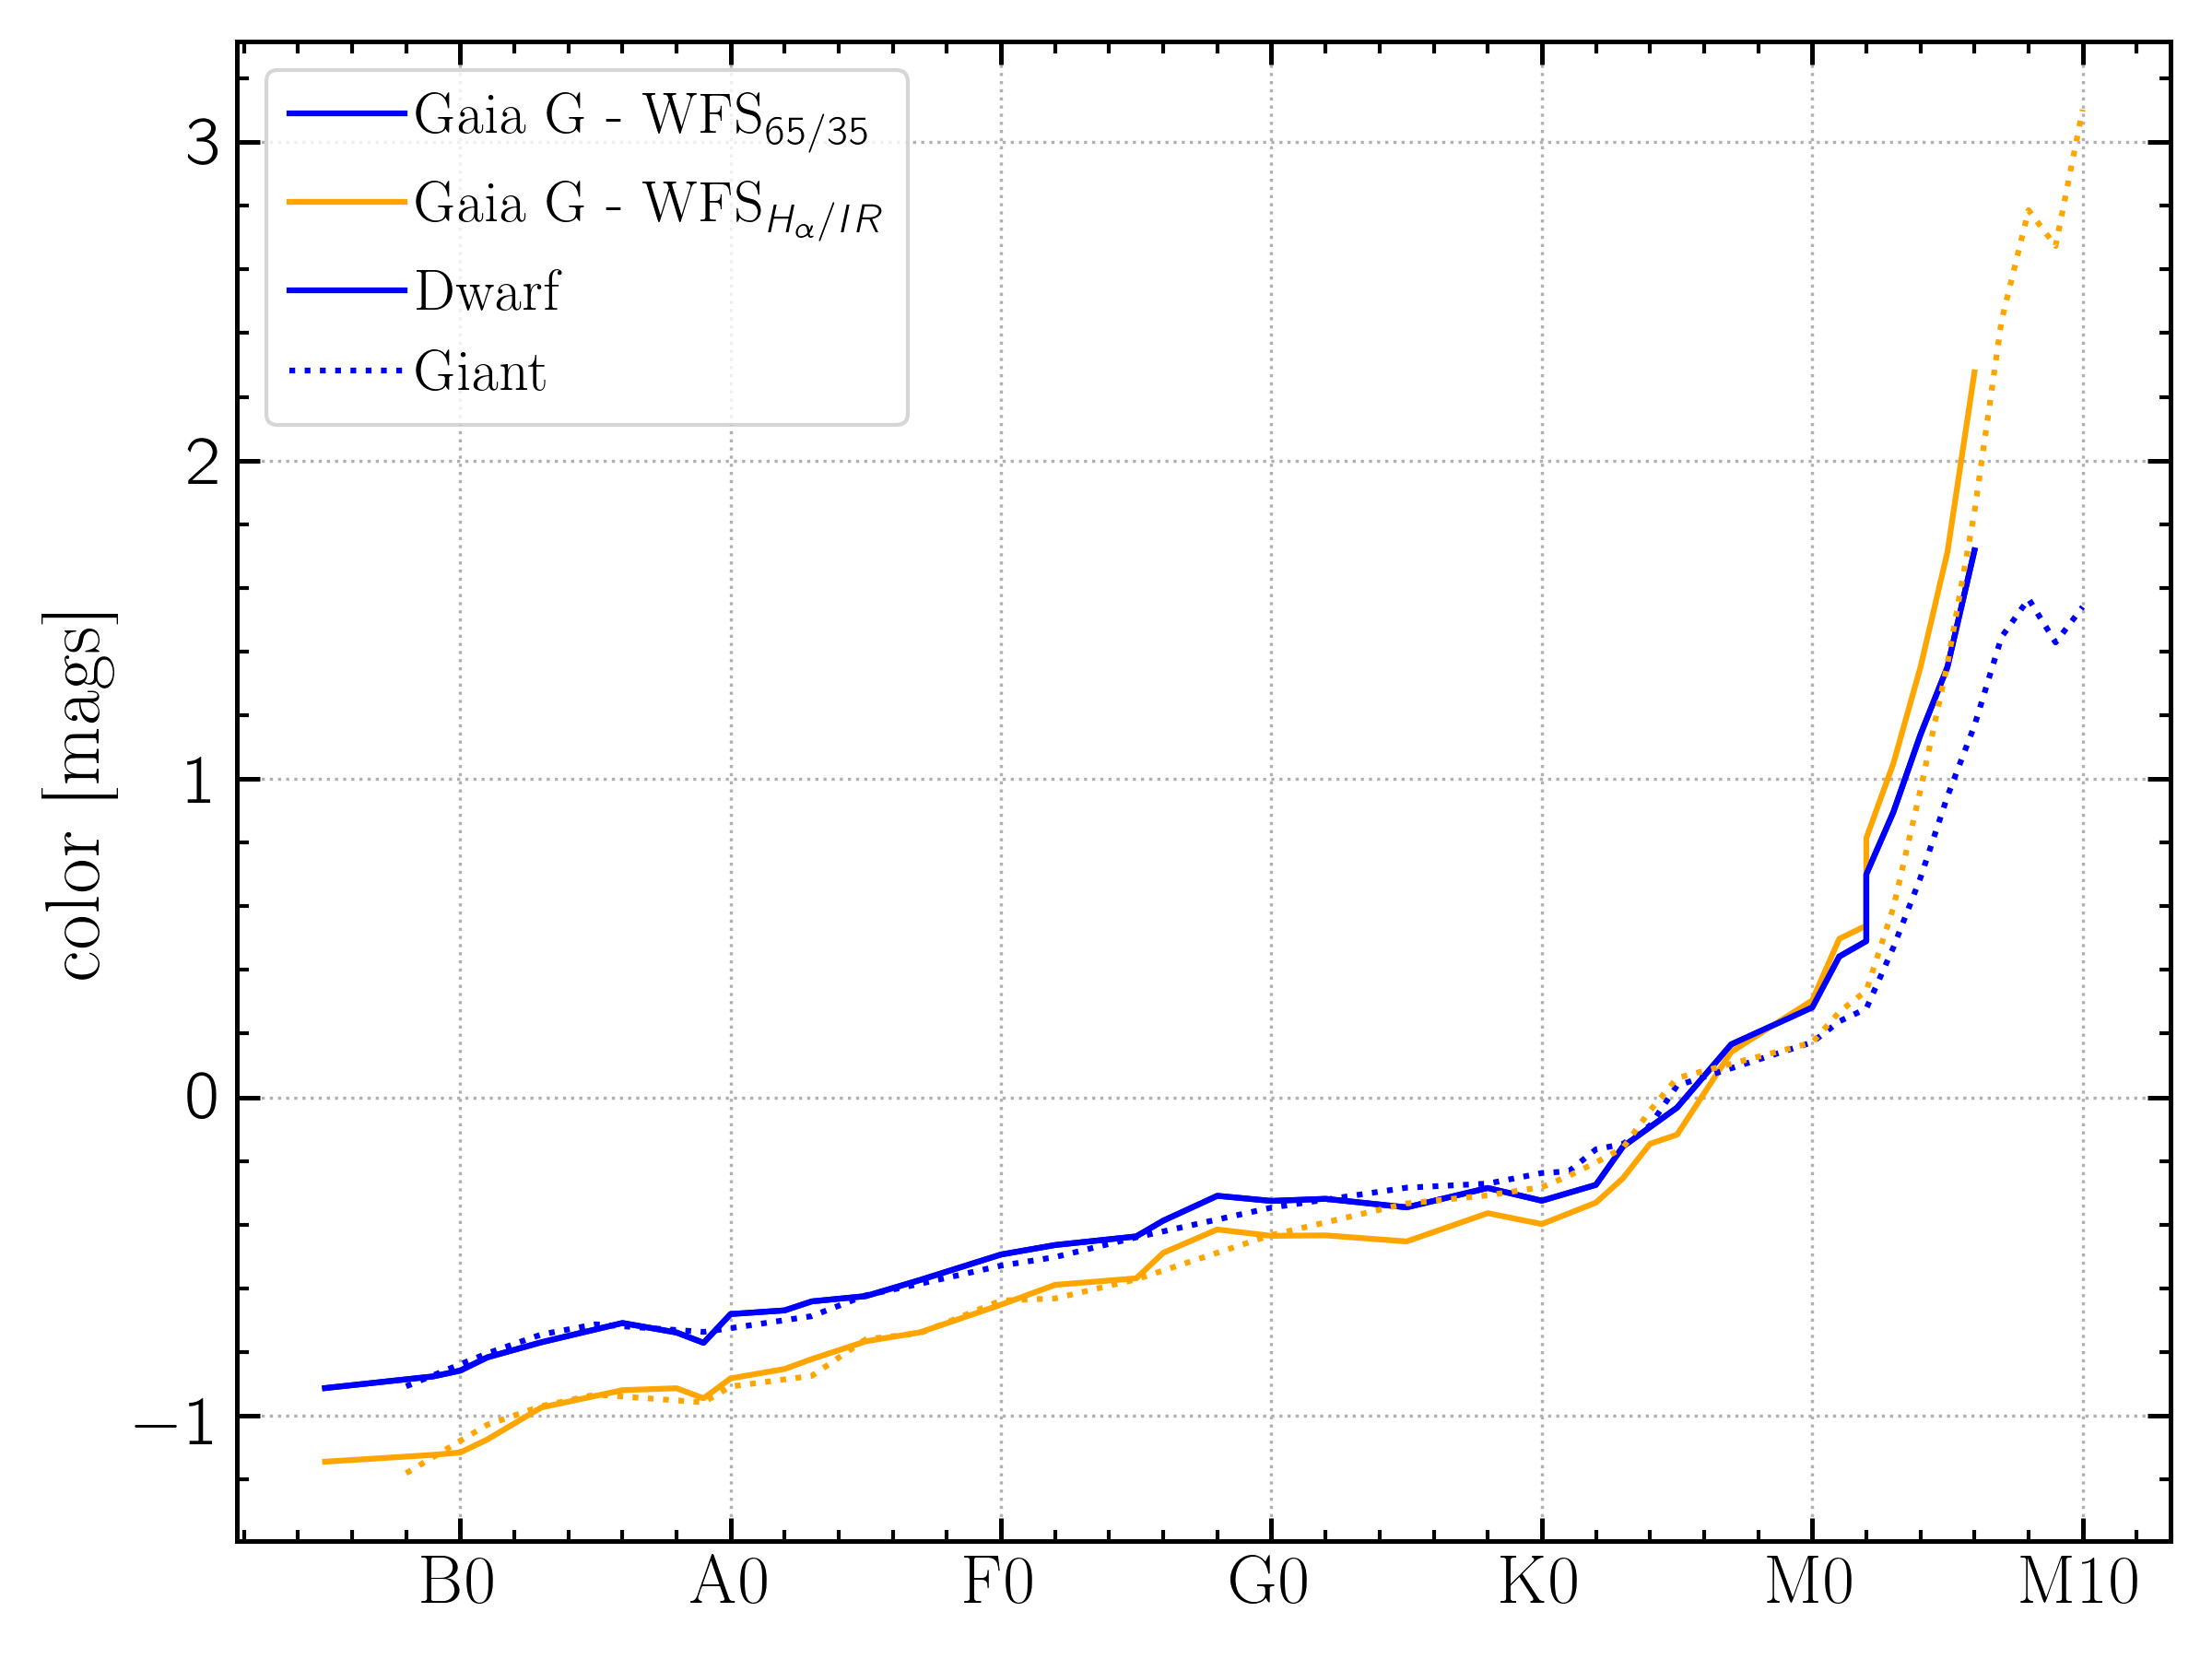
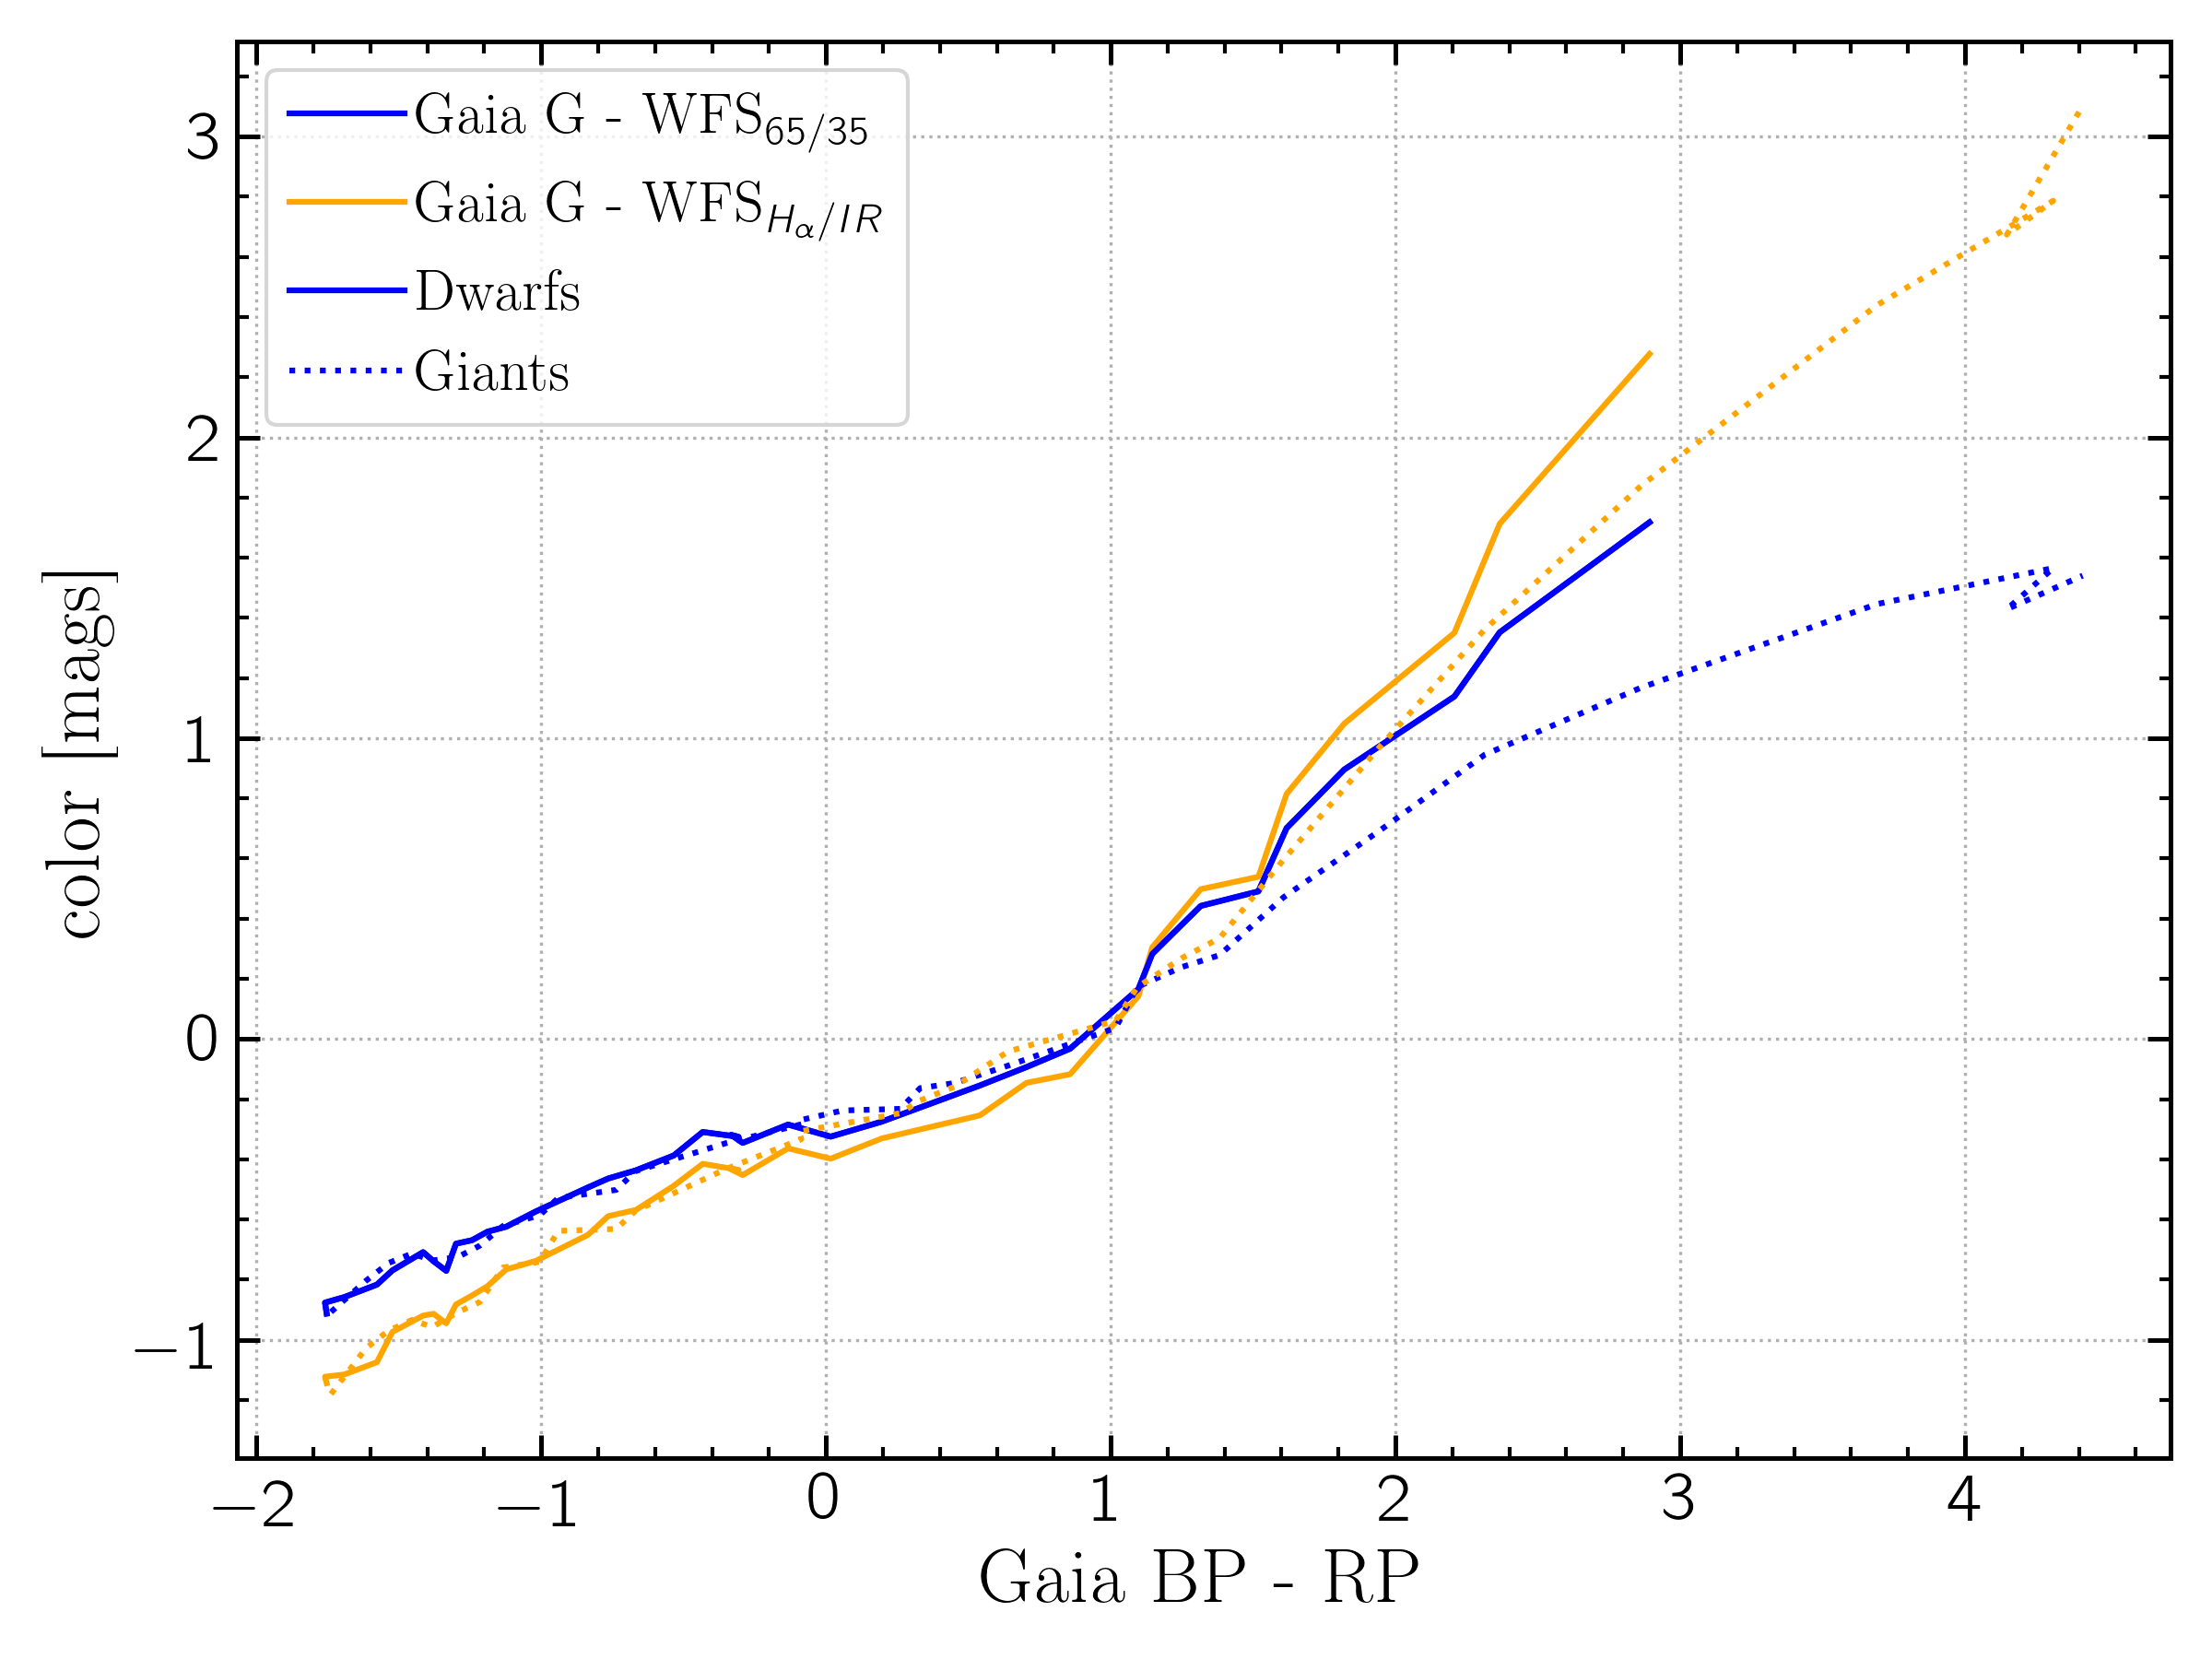
It is helpful if you have an accurate estimate of the magnitude of your guide star in the MagAO-X WFS bandpass. This is a critical parameter for optimizing the AO loop setup for your science, and being close will save time on sky. For most objects, standard I band will be the closest approximation. Note that we have found that SIMBAD reported magnitudes can be as much as ~1 magnitude bright, especially for redder stars. We find much better agreement using the USNO UCAC4 photometry or DENIS survey I magnitude.
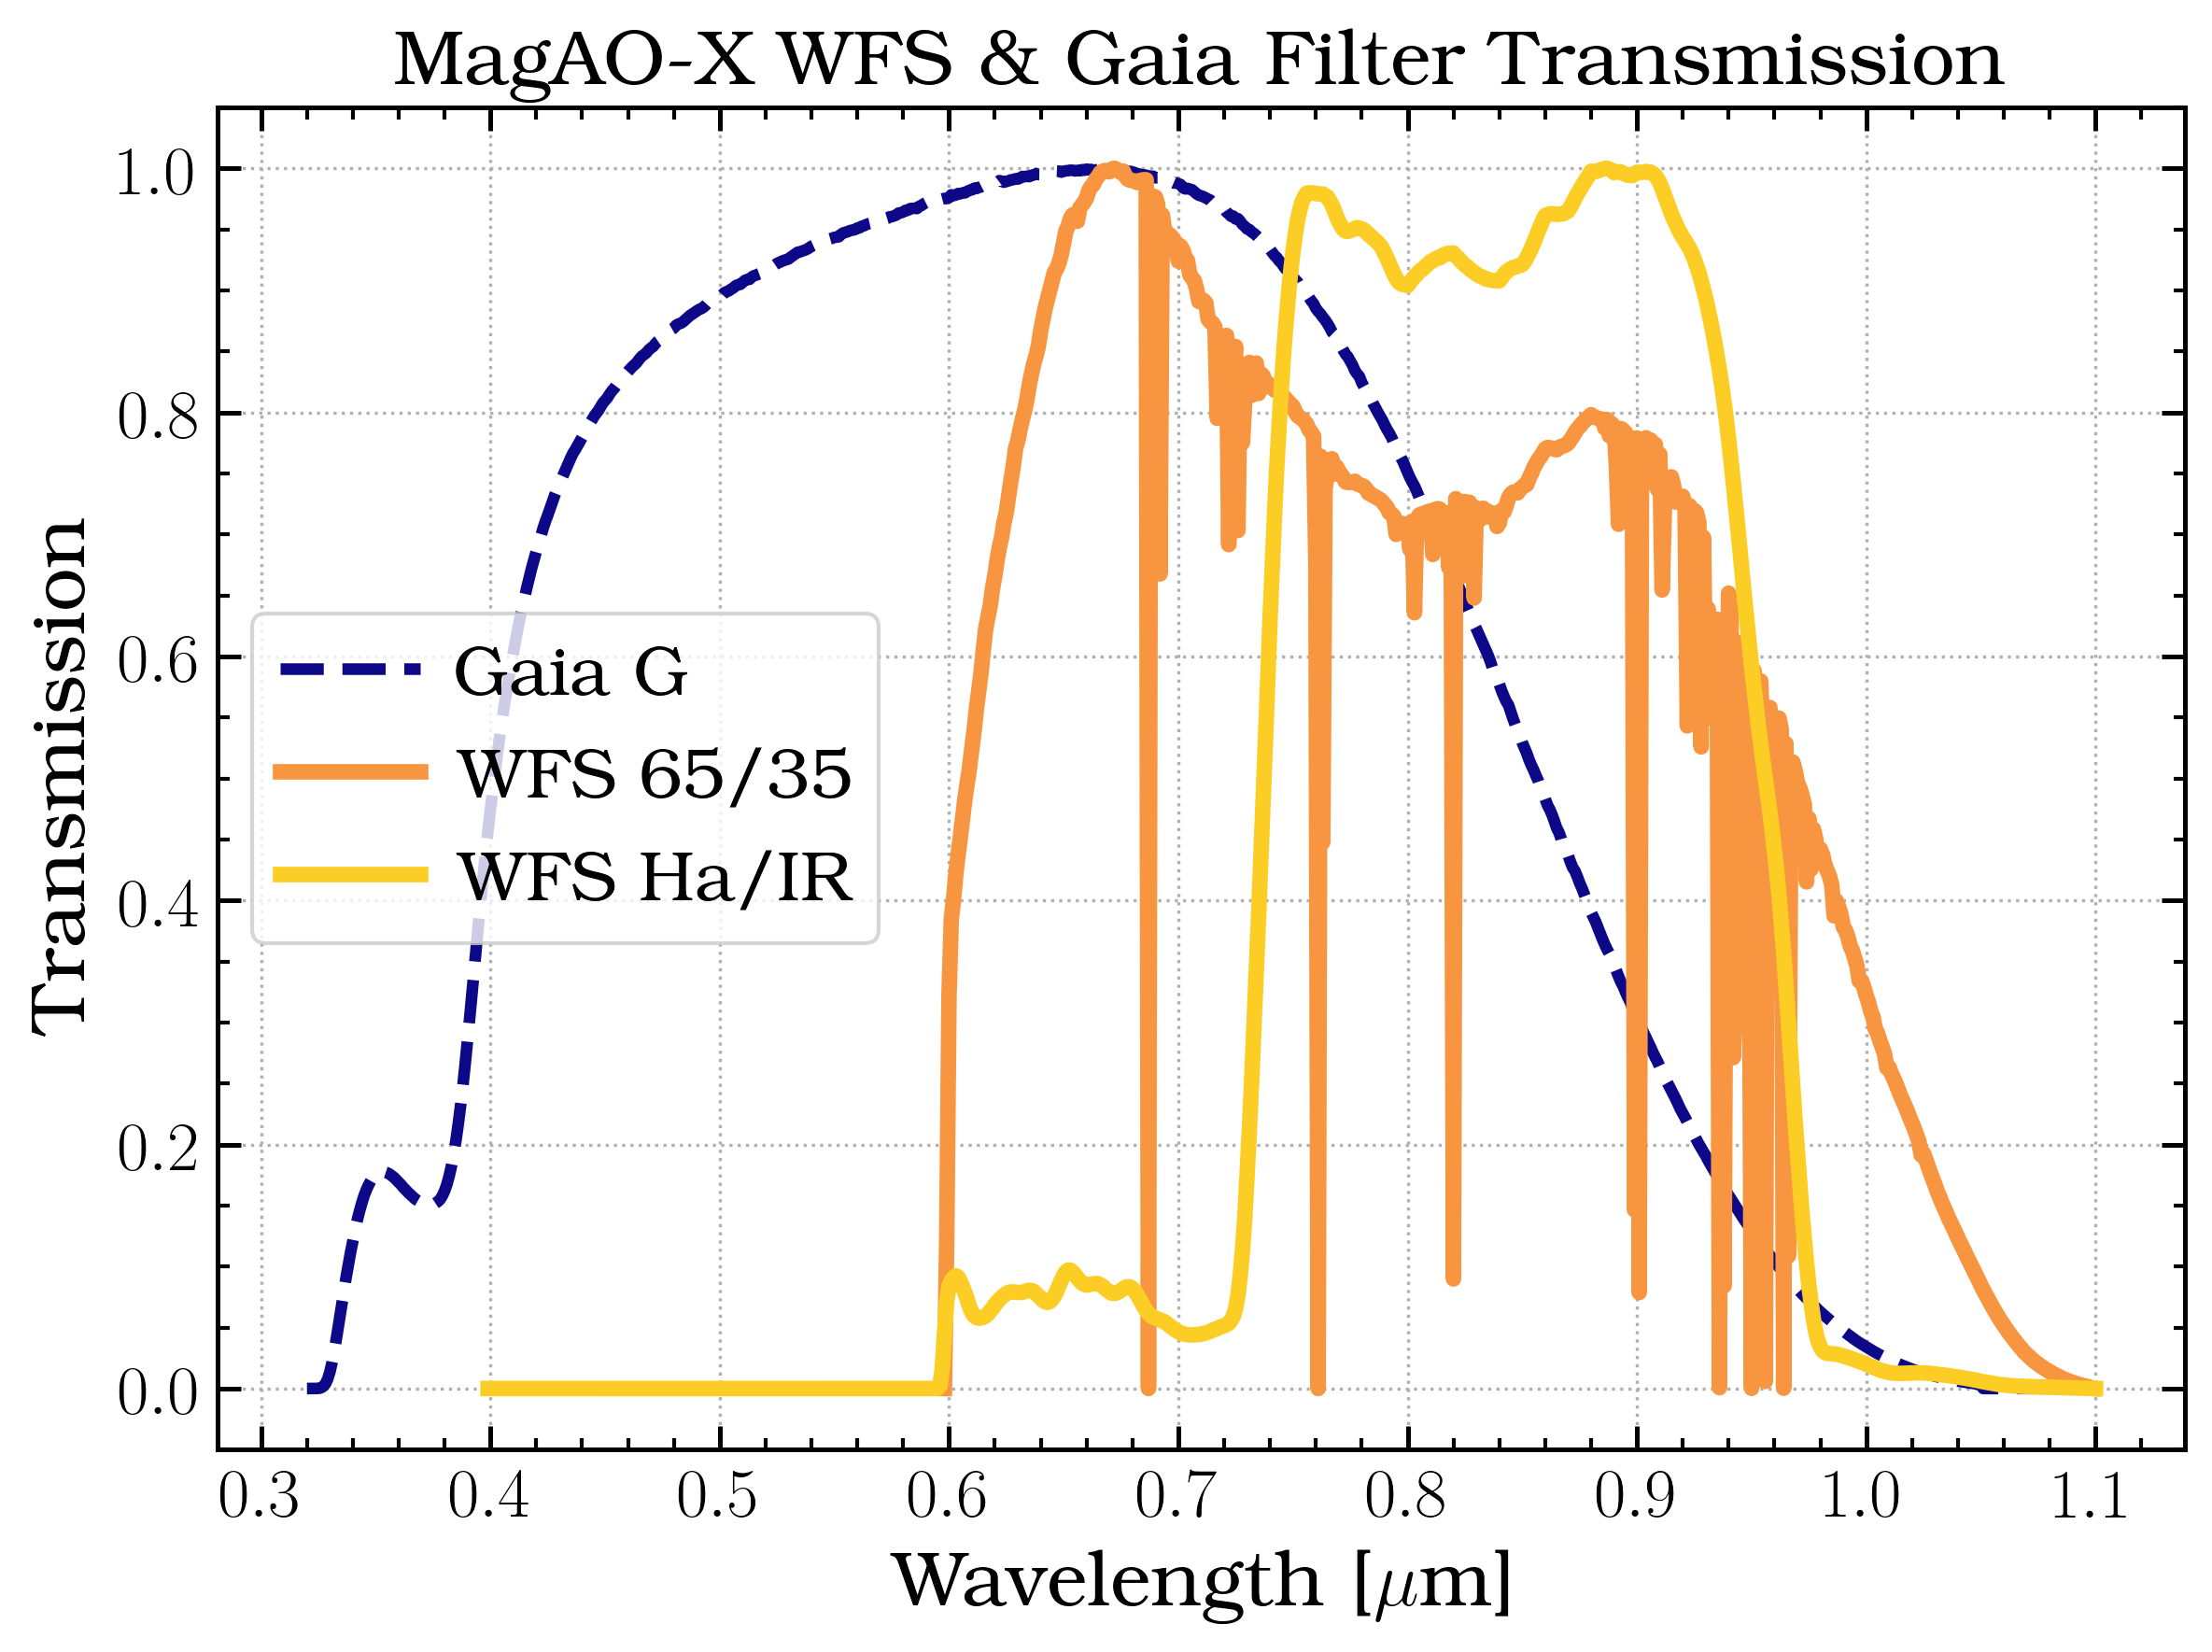
Alternately you can use Gaia G band magnitude and correct the color to the WFS bandpasses. These curves give an estimate of the color correction for Gaia G to WFS 65/35 (blue) and WFS Halpha/IR (orange) for main sequence stars (solid) and giants (dotted) by spectral type. Computed using Pickles stellar models and Gaia G-band public filter curves.
MagAO-X WFS and Gaia G bandpasses with atm model:
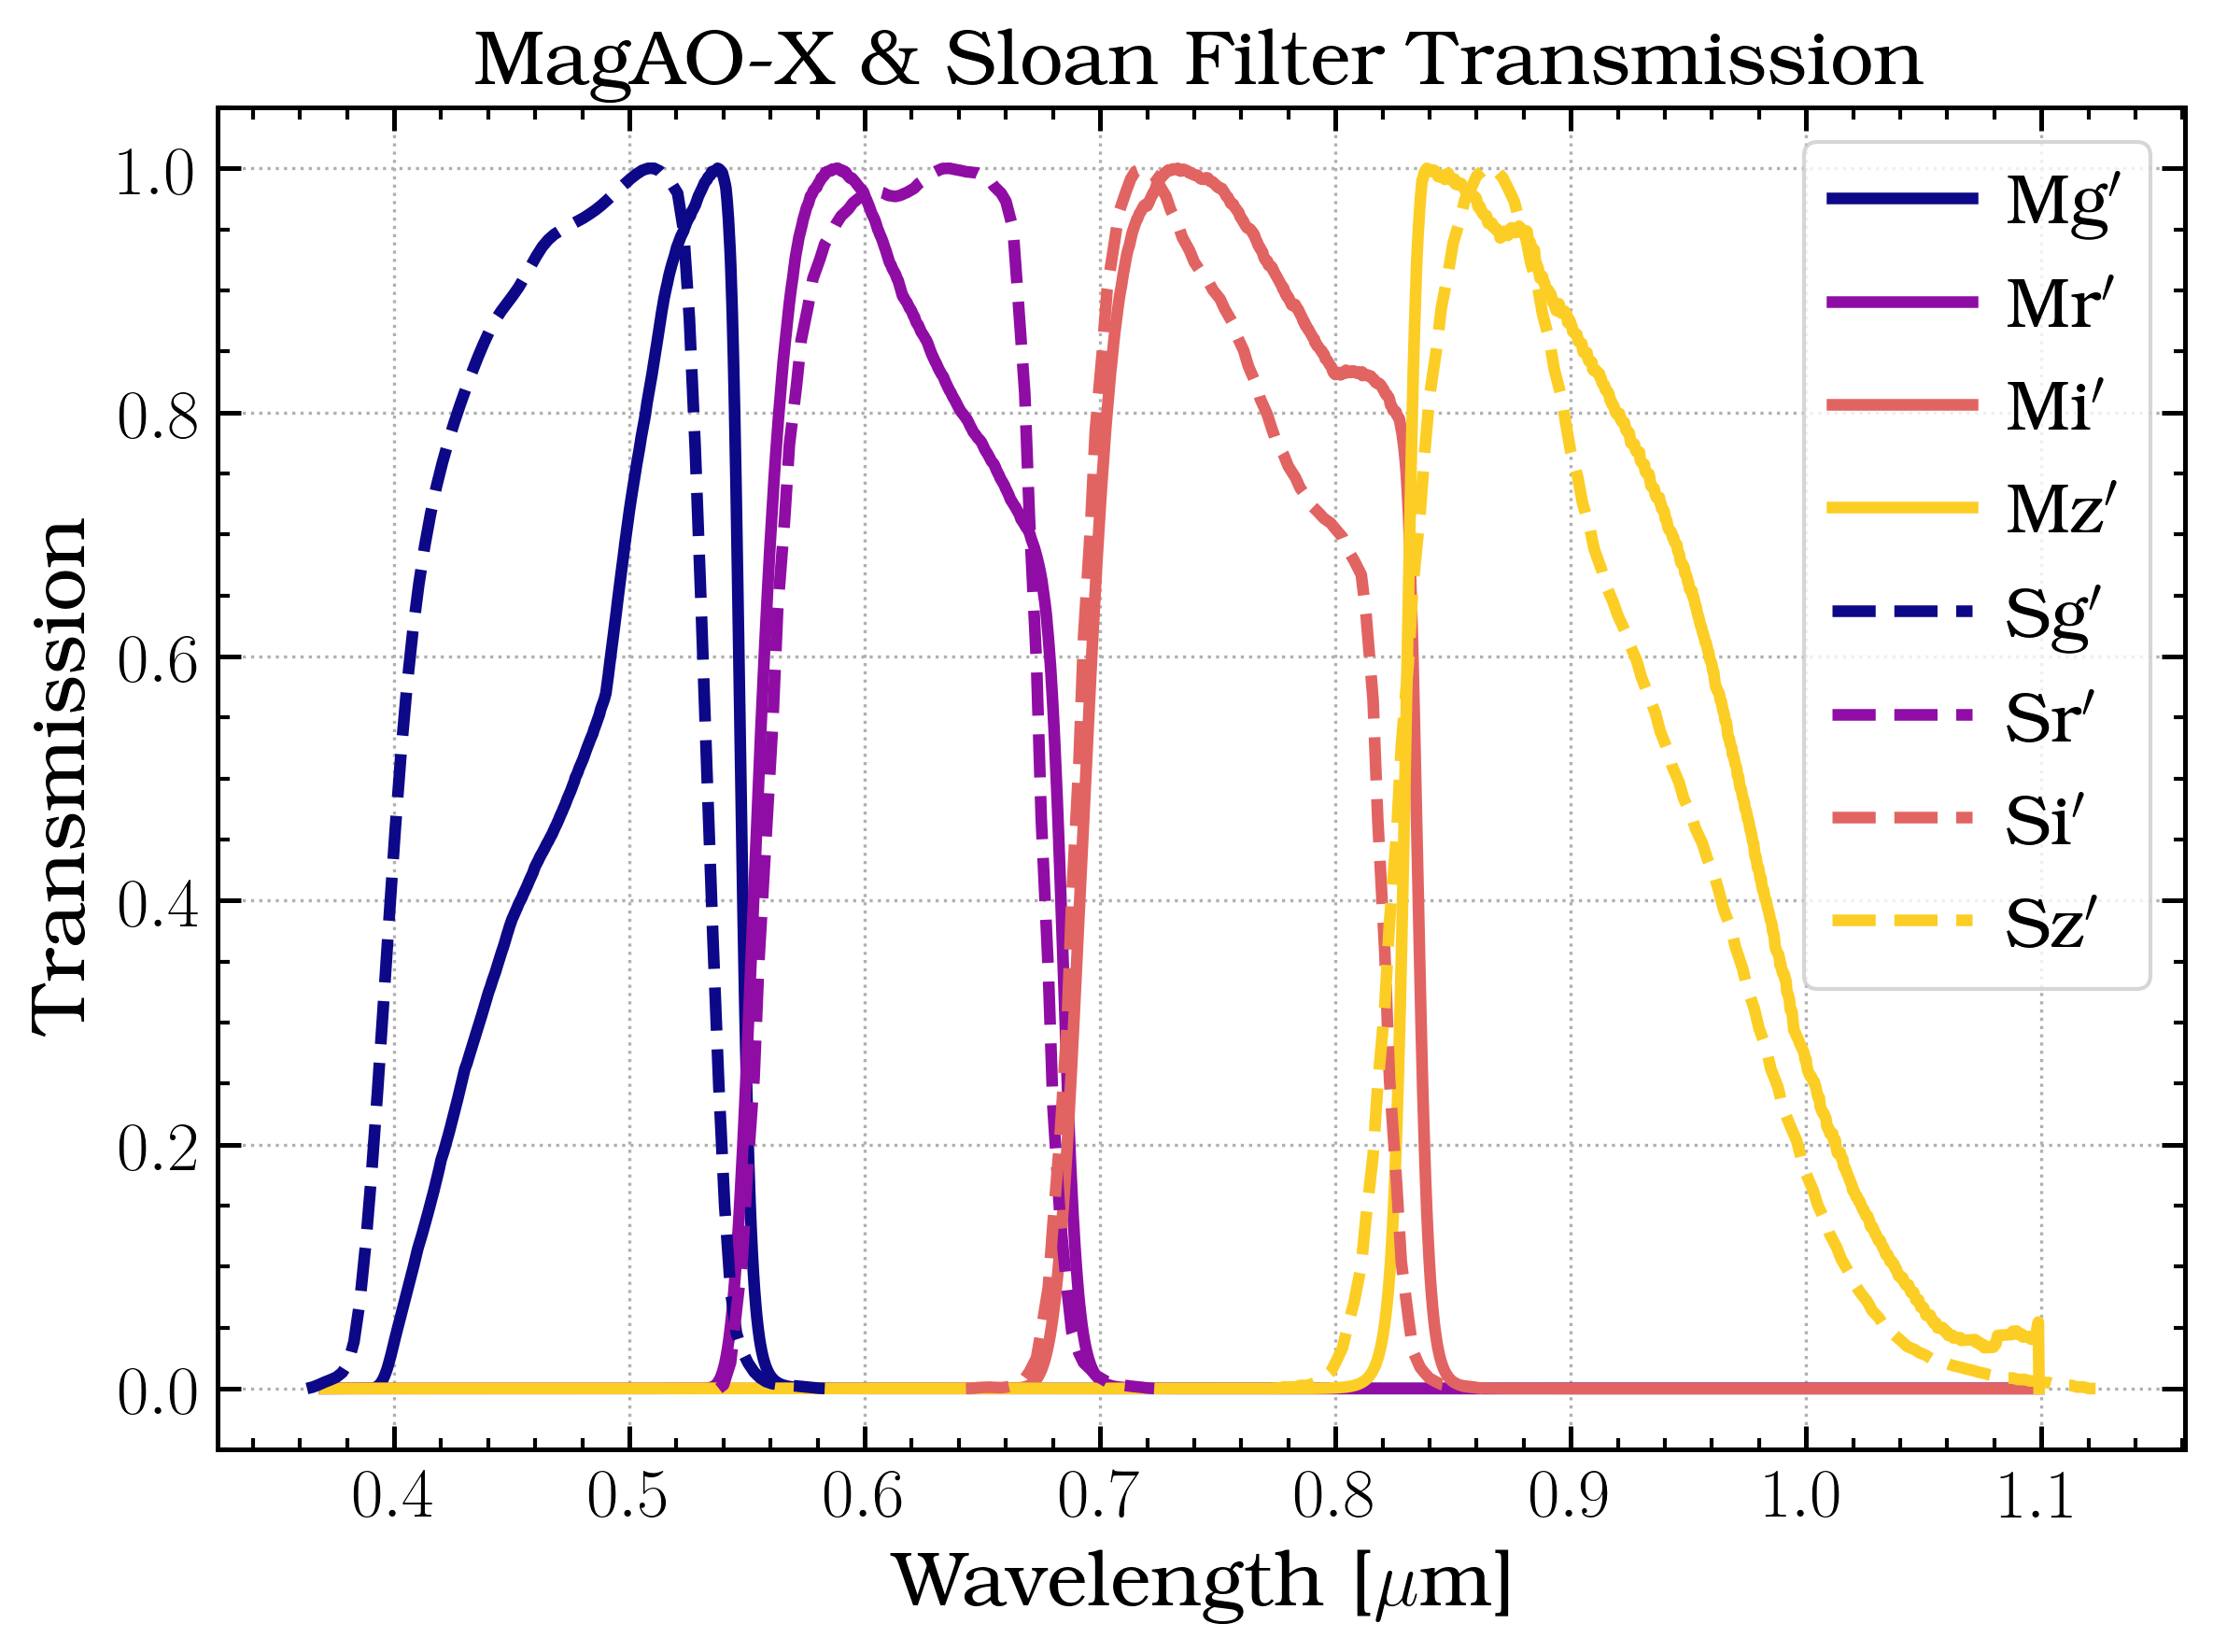
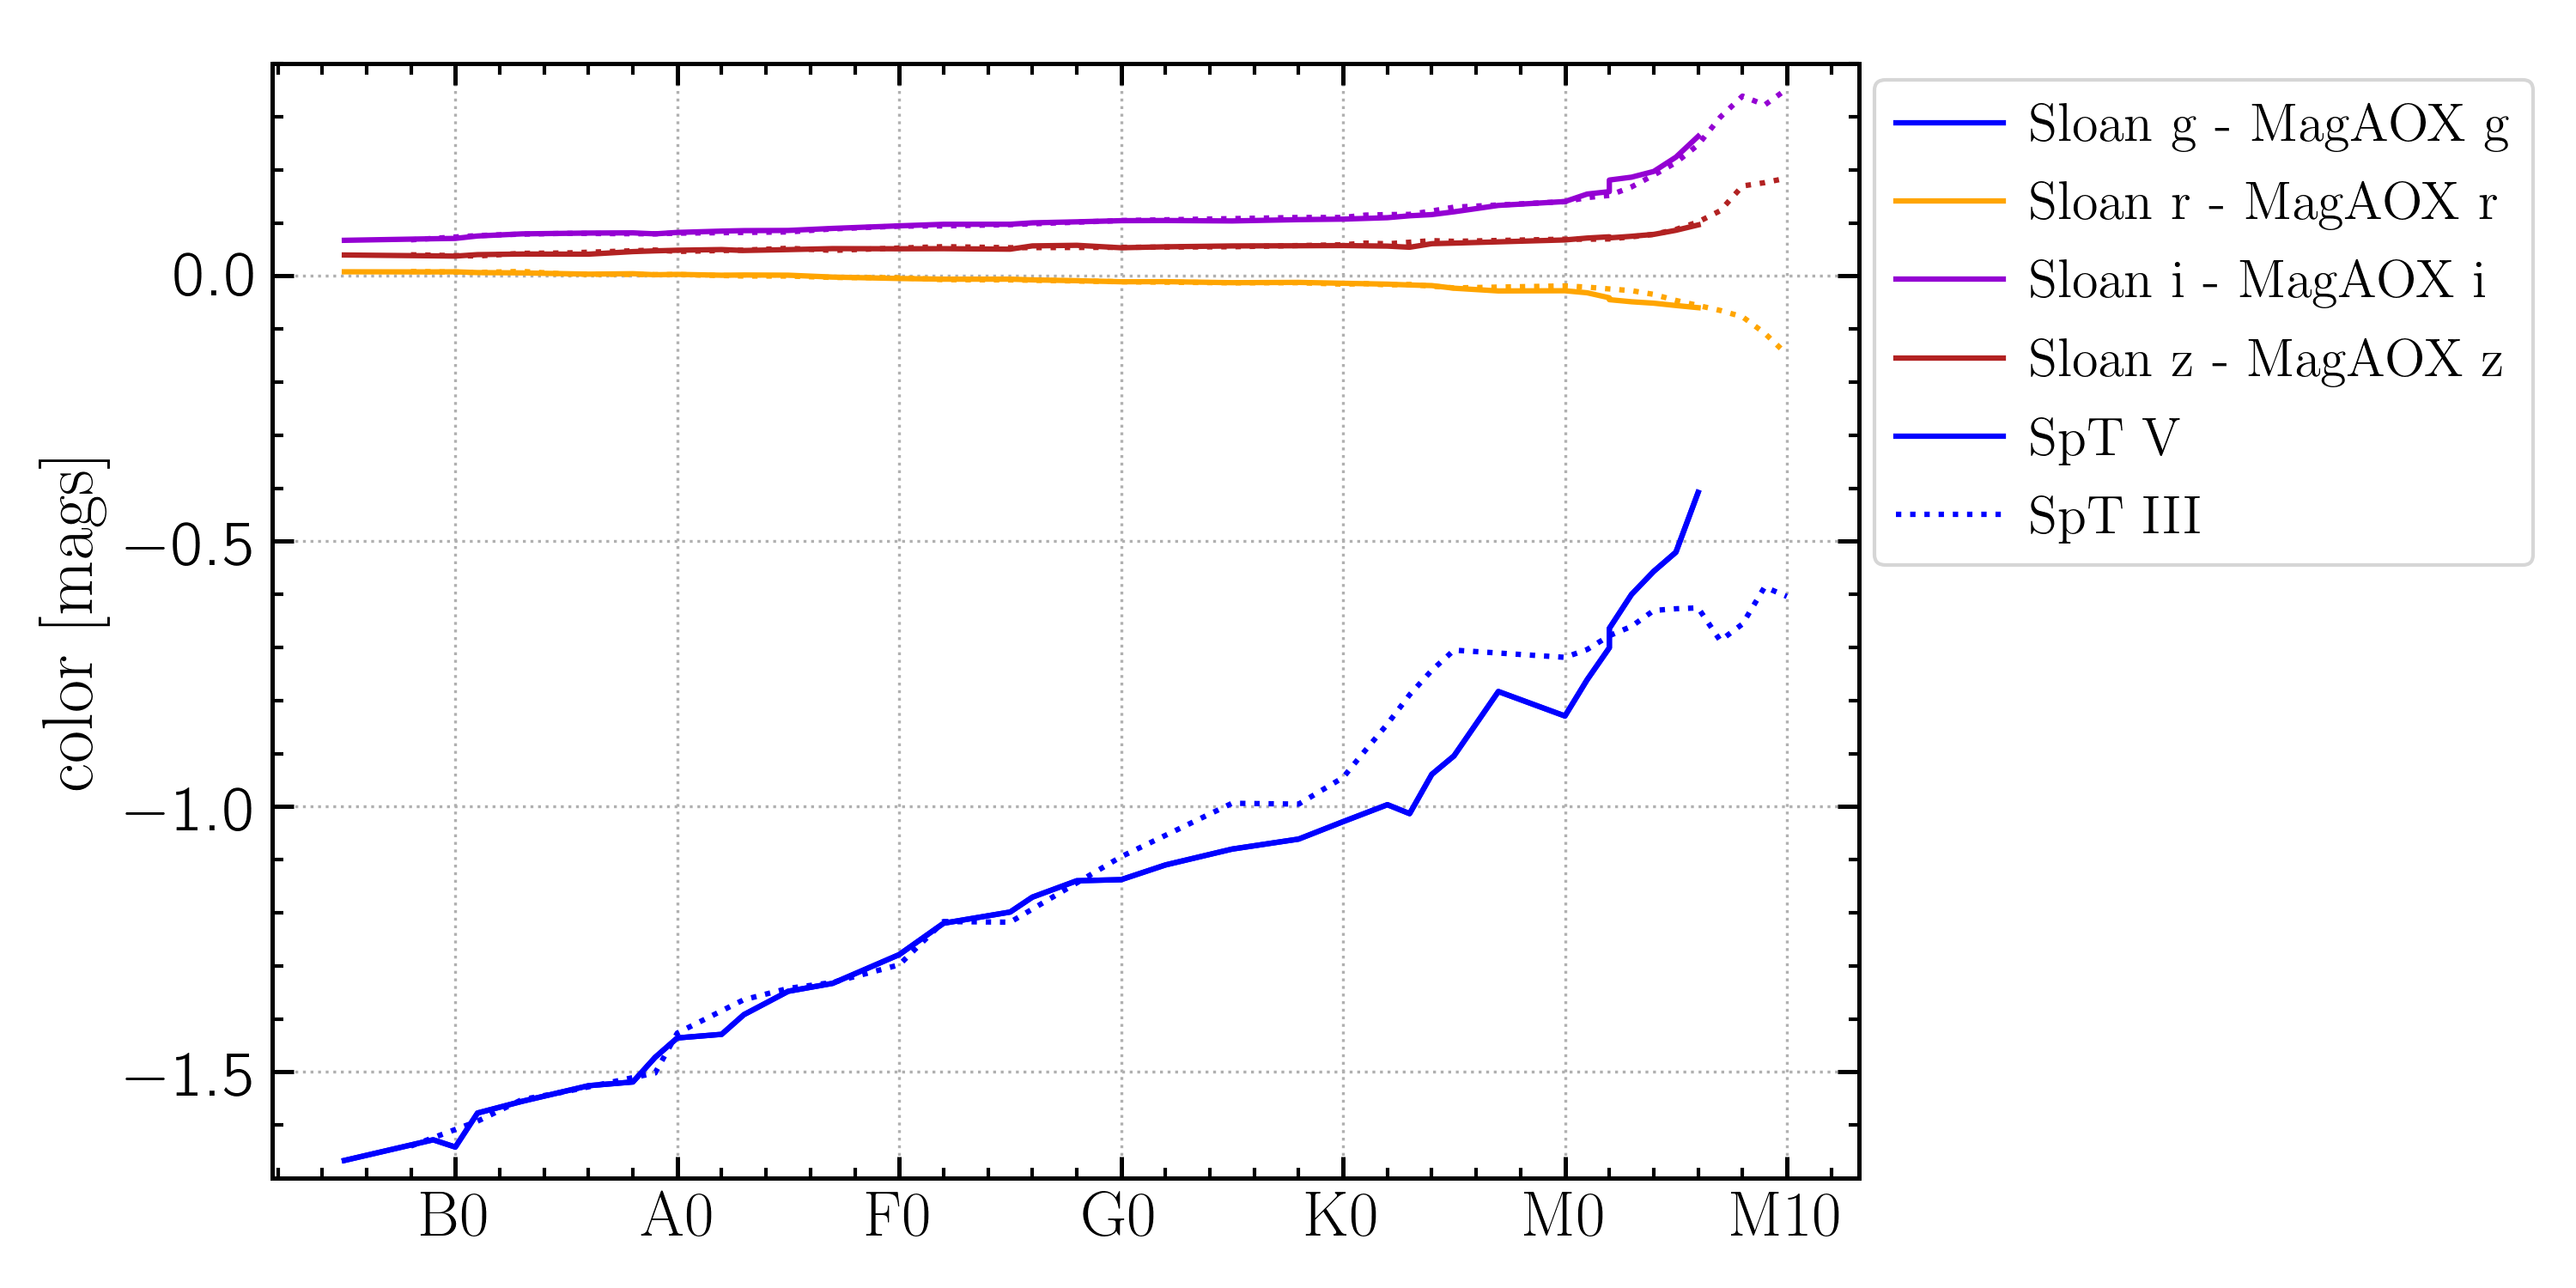
MagAO-X conversion to Sloan filter system